DI in CMAT 2025 Slot 1 Actual Questions
Data Interpretation: Pie Chart Analysis
Instructions [1-3]: Study the given details carefully to answer the questions.
The following data represents the breakup of students studying in different specializations at a management college and those who recently got placed.
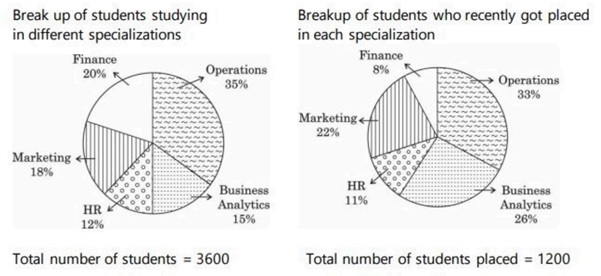
-
The total number of students who got placed from all the specialization together was what percentage of total number of students pursuing specialization in operations, marketing and finance collectively?
- 43.21%
- 44.89%
- 45.66%
- 46.22%
Correct Answer: CStep-by-step Solution:
1. Total placed from all specializations = 1200.
2. Students in Operations, Marketing, Finance = 1260 (Op) + 648 (Mkt) + 720 (Fin) = 2628.
3. Percentage = (1200 / 2628) × 100 = 45.662...%
Result: 45.66% -
What is the difference between the total number of students pursuing specialization in Business Analytics and HR combined and the number of student who got placed from marketing specialization and finance specialization combined?
- 812
- 972
- 582
- 612
Correct Answer: DStep-by-step Solution:
1. Students in BA + HR = 540 (BA) + 432 (HR) = 972.
2. Students placed in Mkt + Fin = 264 (Mkt) + 96 (Fin) = 360.
3. Difference = 972 - 360 = 612.
Result: 612 -
The number of students who got placed from the HR specialization was what percent of the total number of students studying in that specialization?
- 36.18%
- 30.56%
- 47.22%
- 28.16%
Correct Answer: BStep-by-step Solution:
1. Total students in HR = 432.
2. Students placed from HR = 132.
3. Percentage = (132 / 432) × 100 = 30.555...%
Result: 30.56%